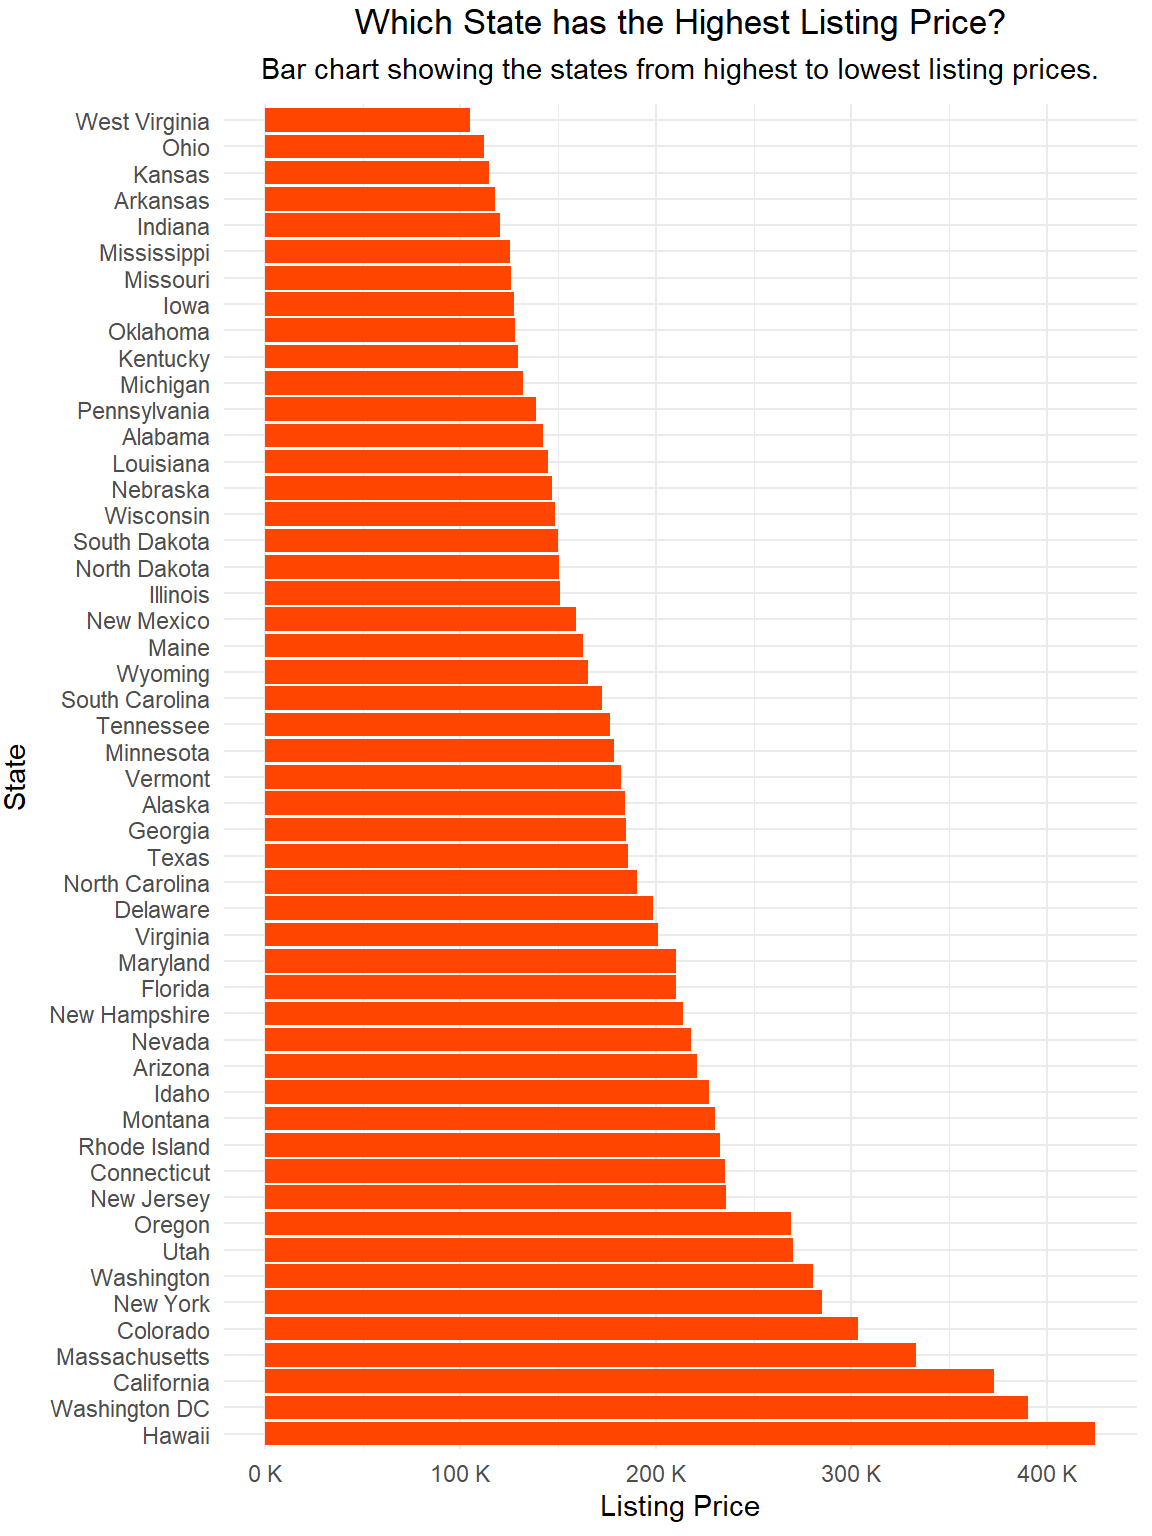
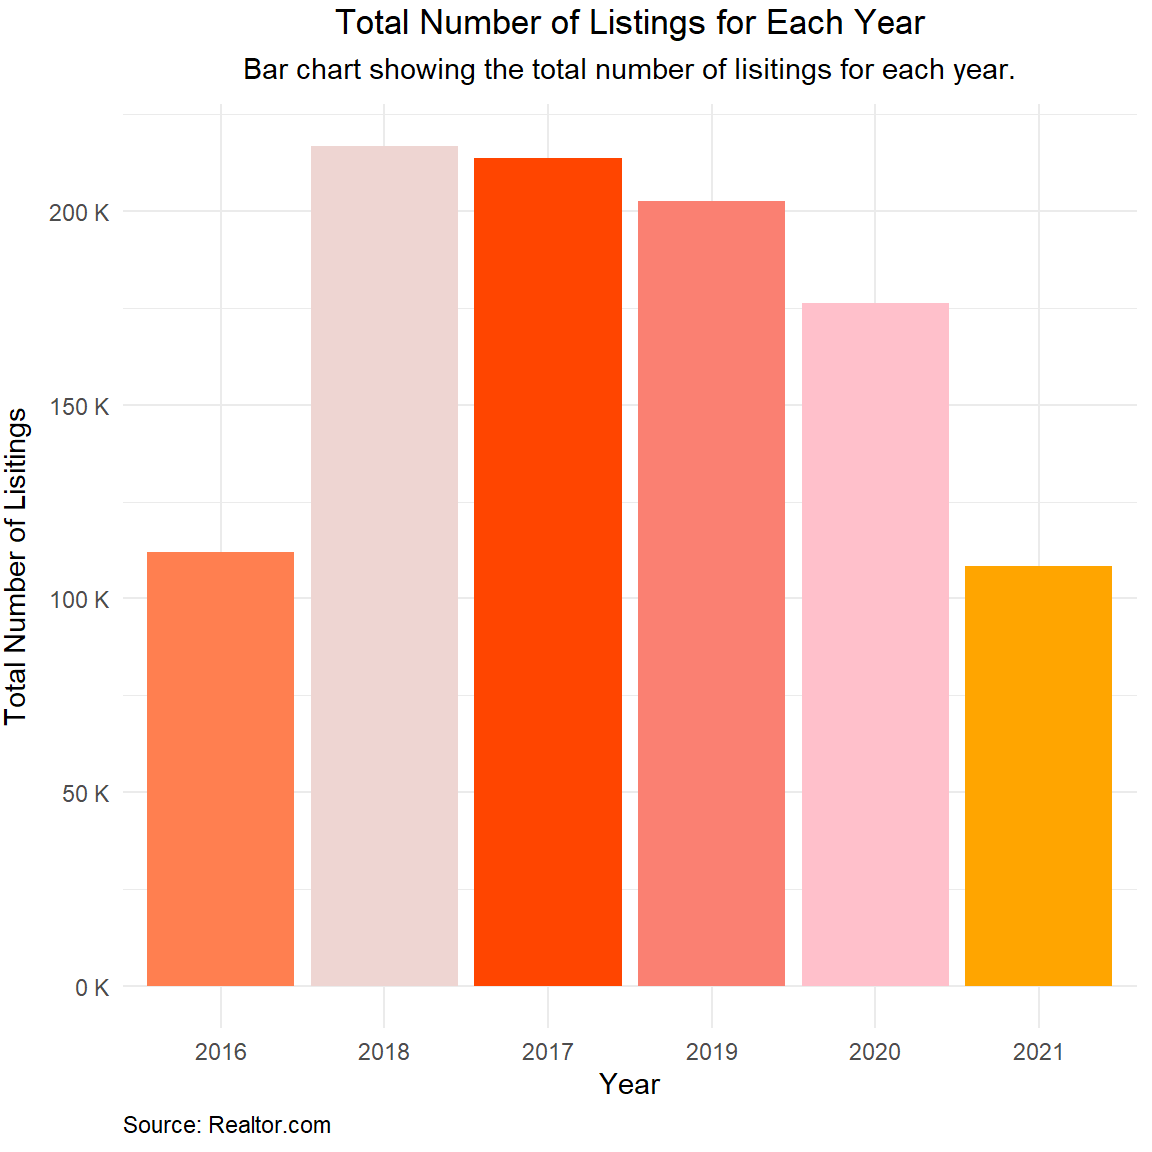
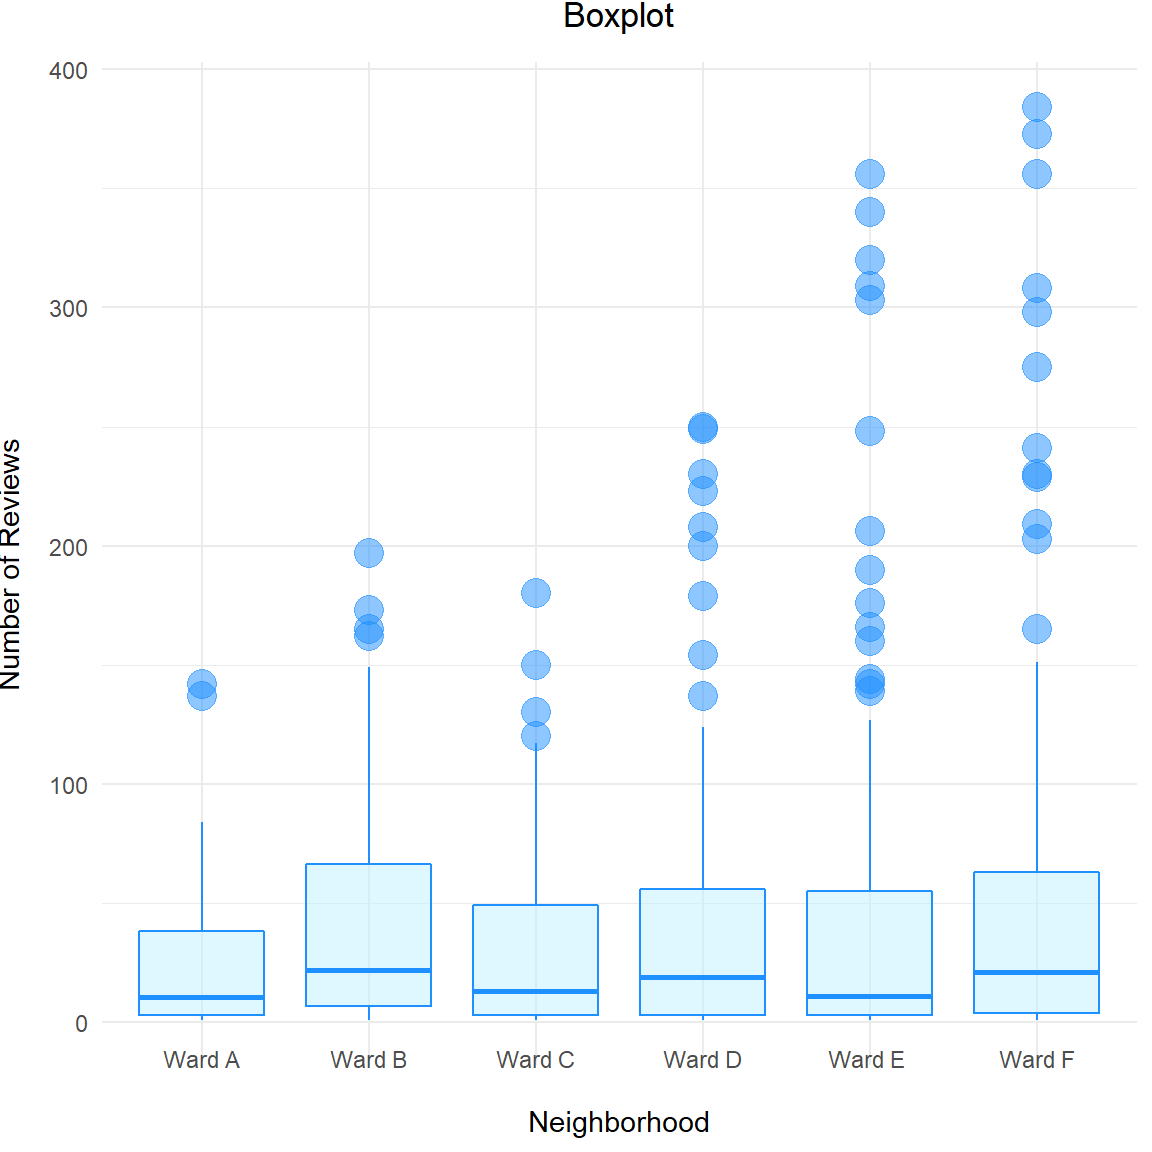
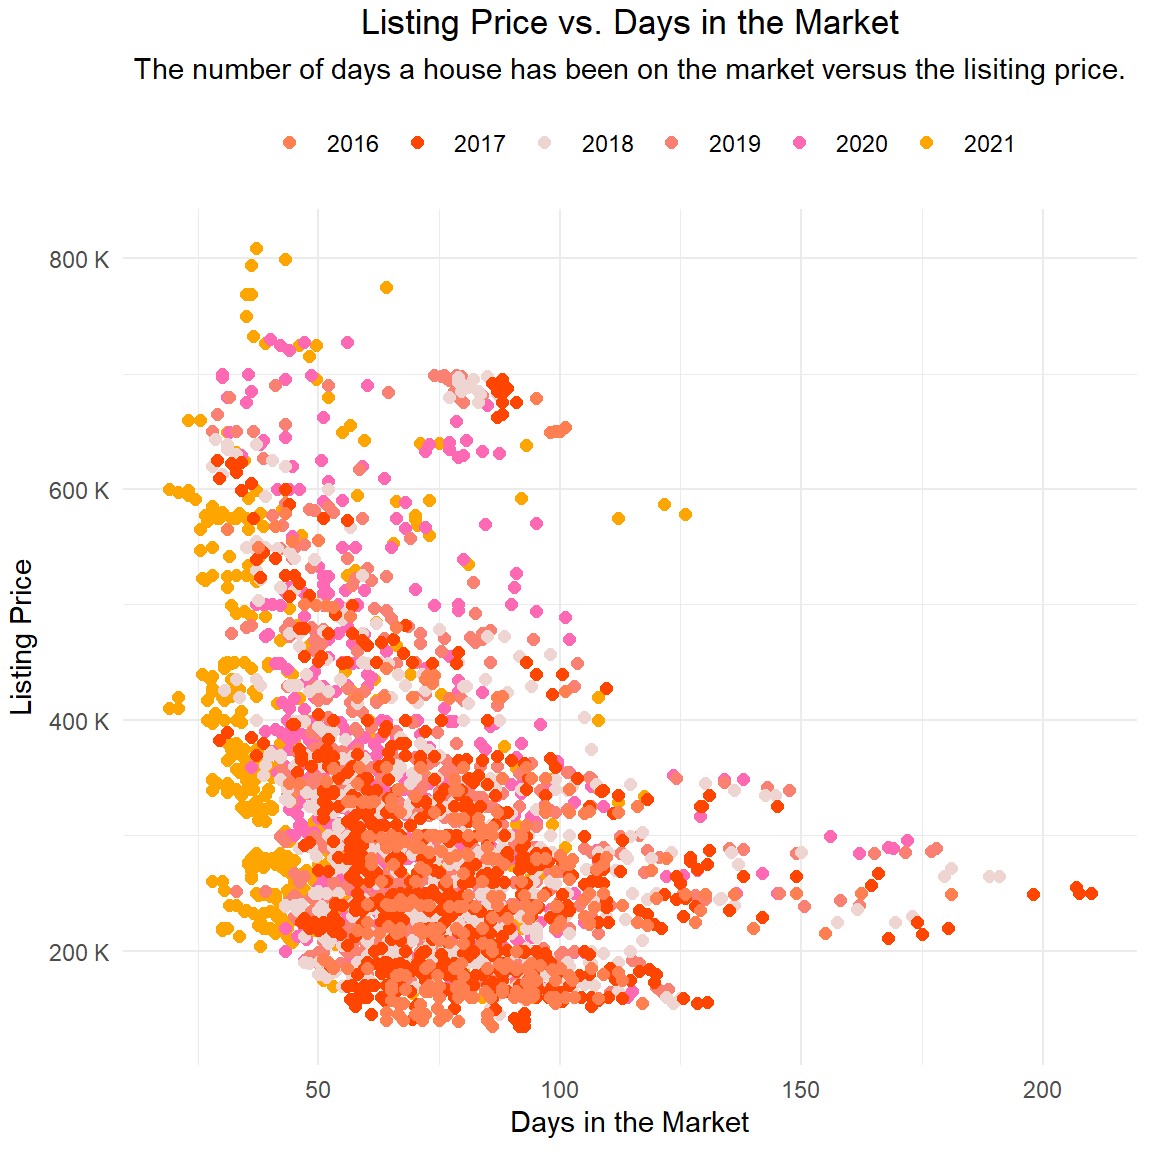
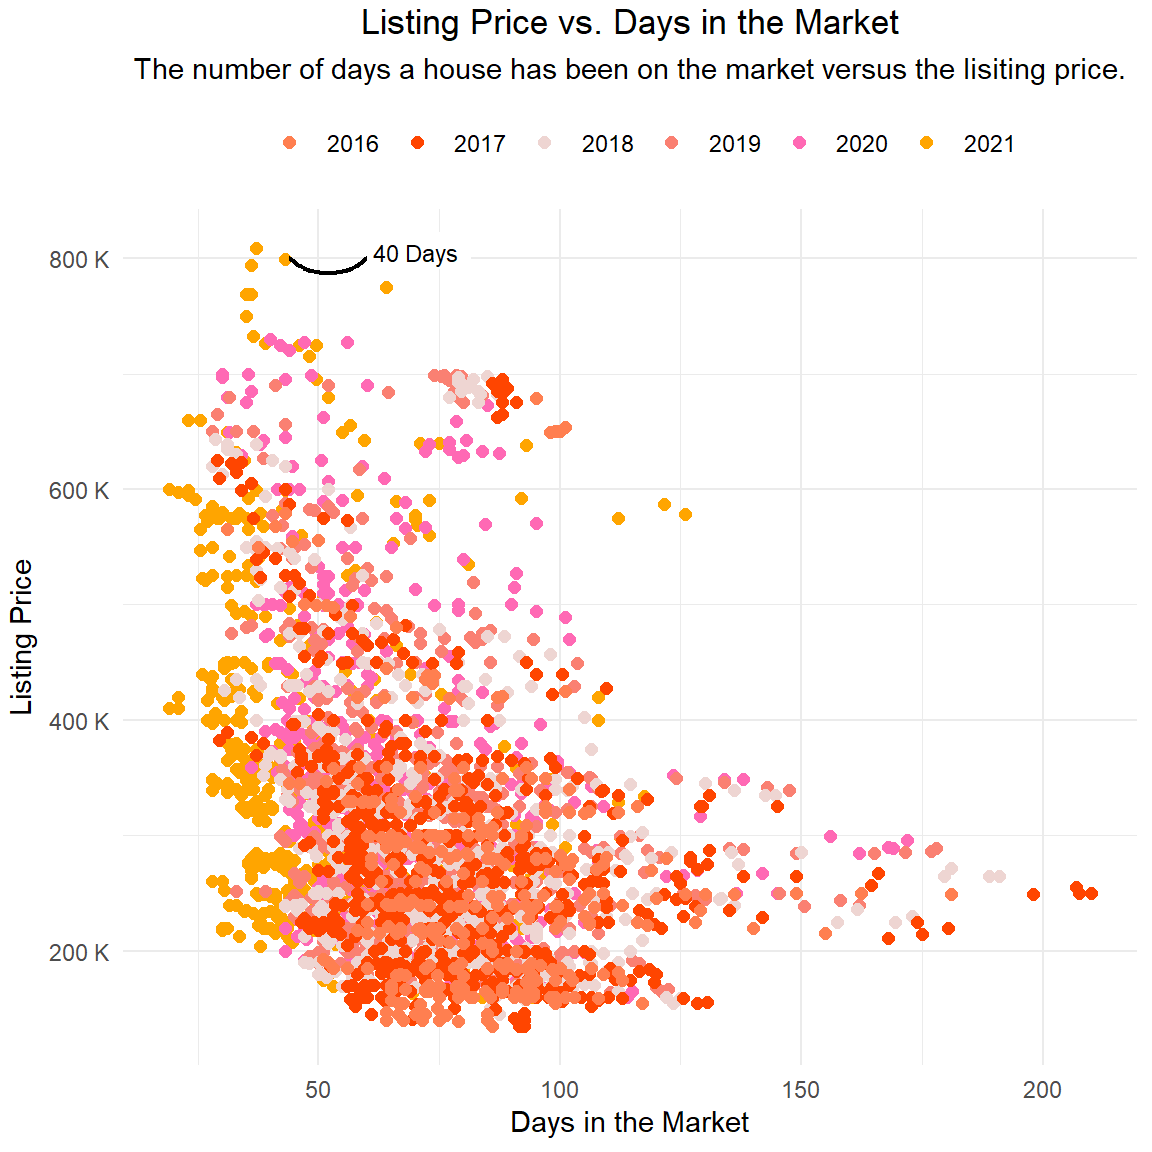
Visualizations Created with R - ggplot2
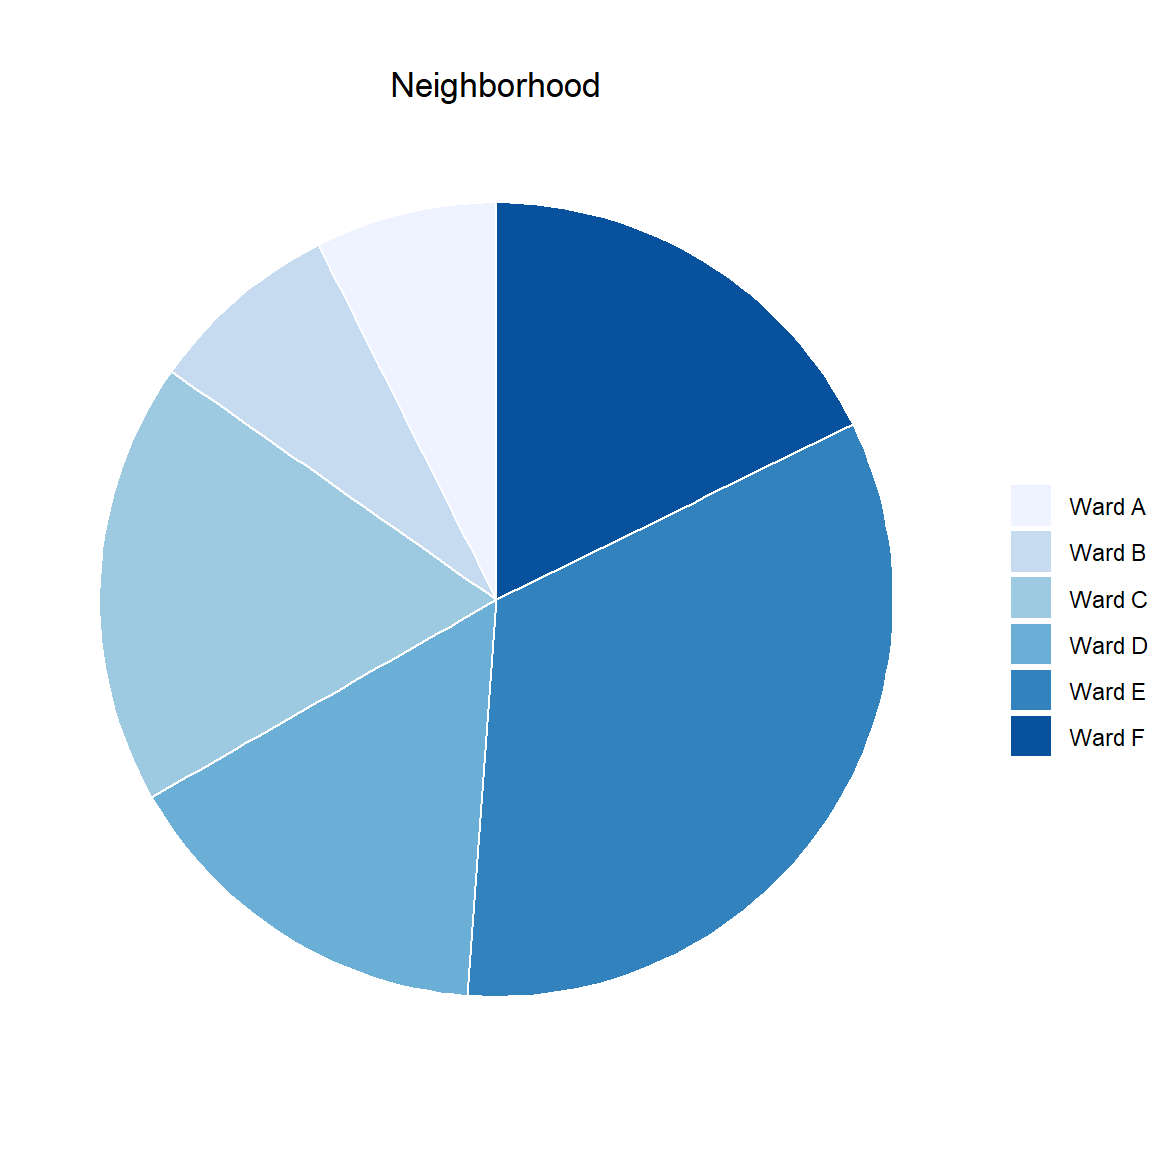
Visualizations Created with R - Base R
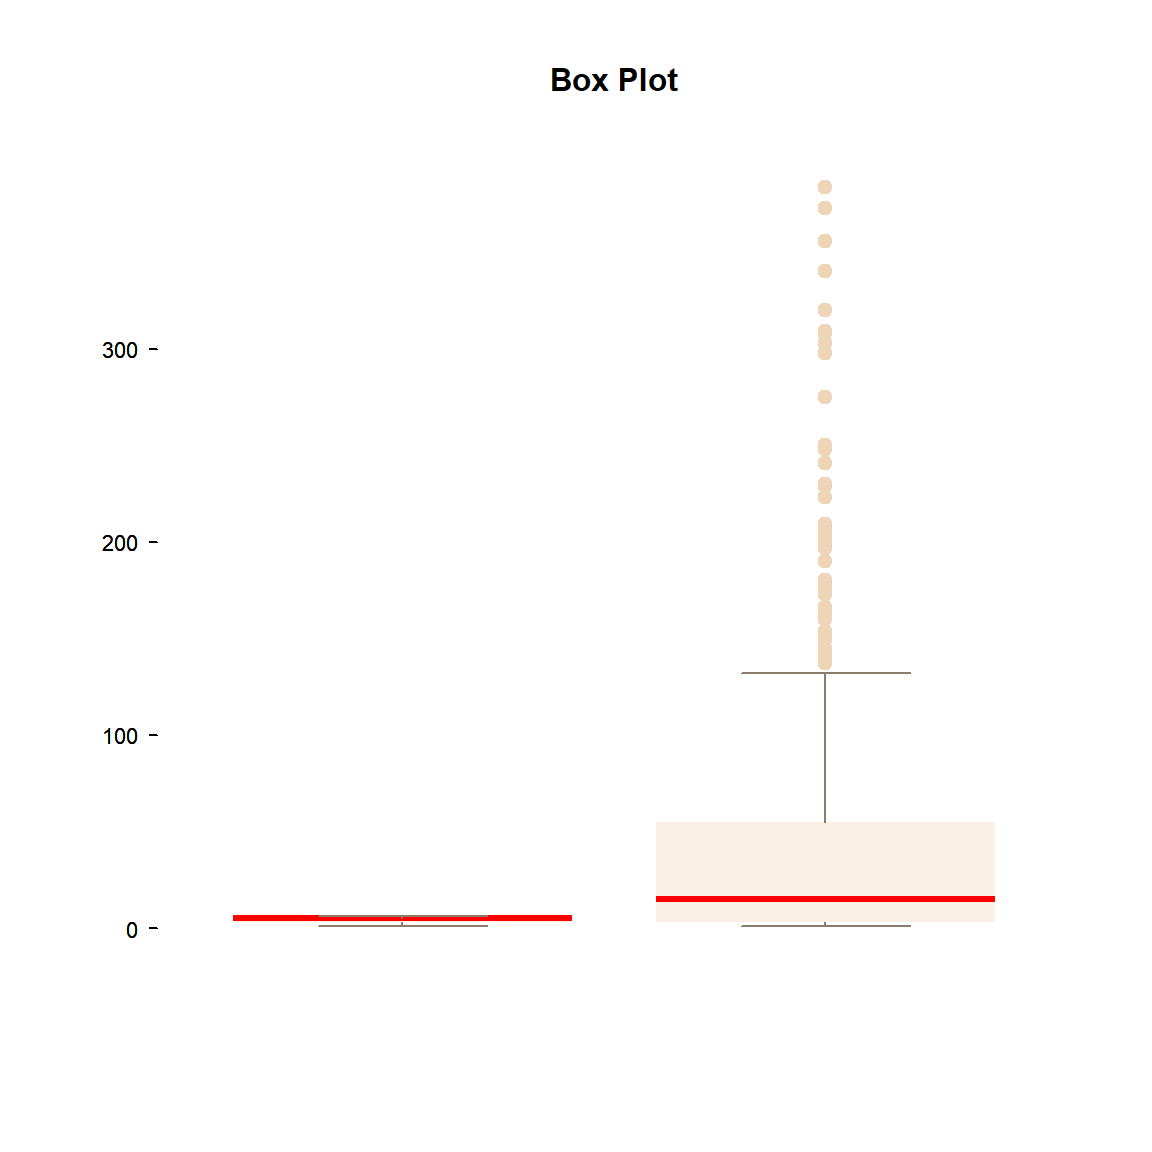
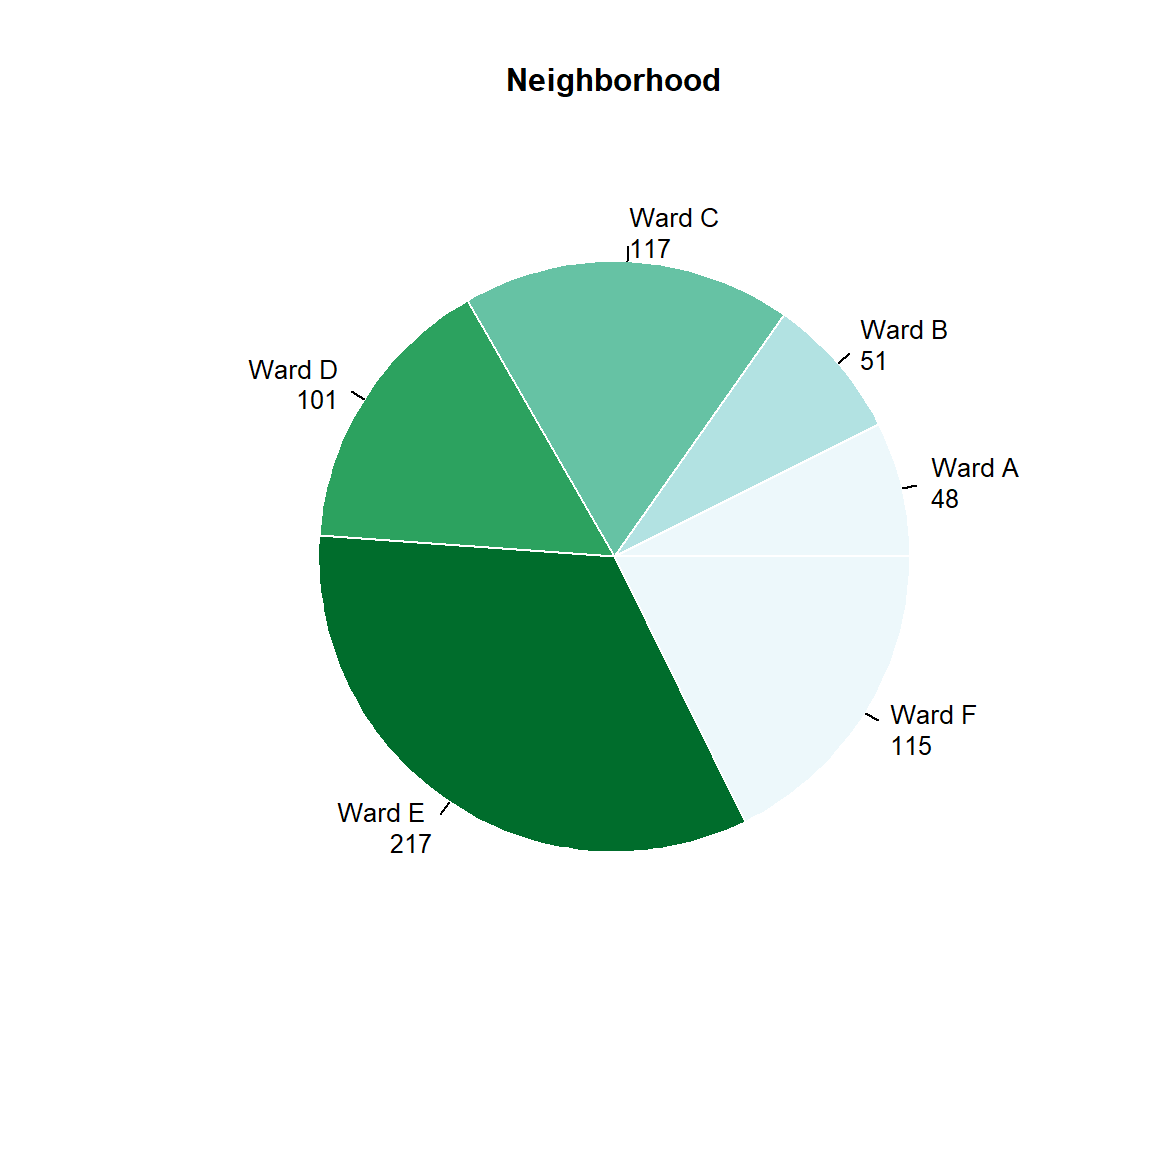
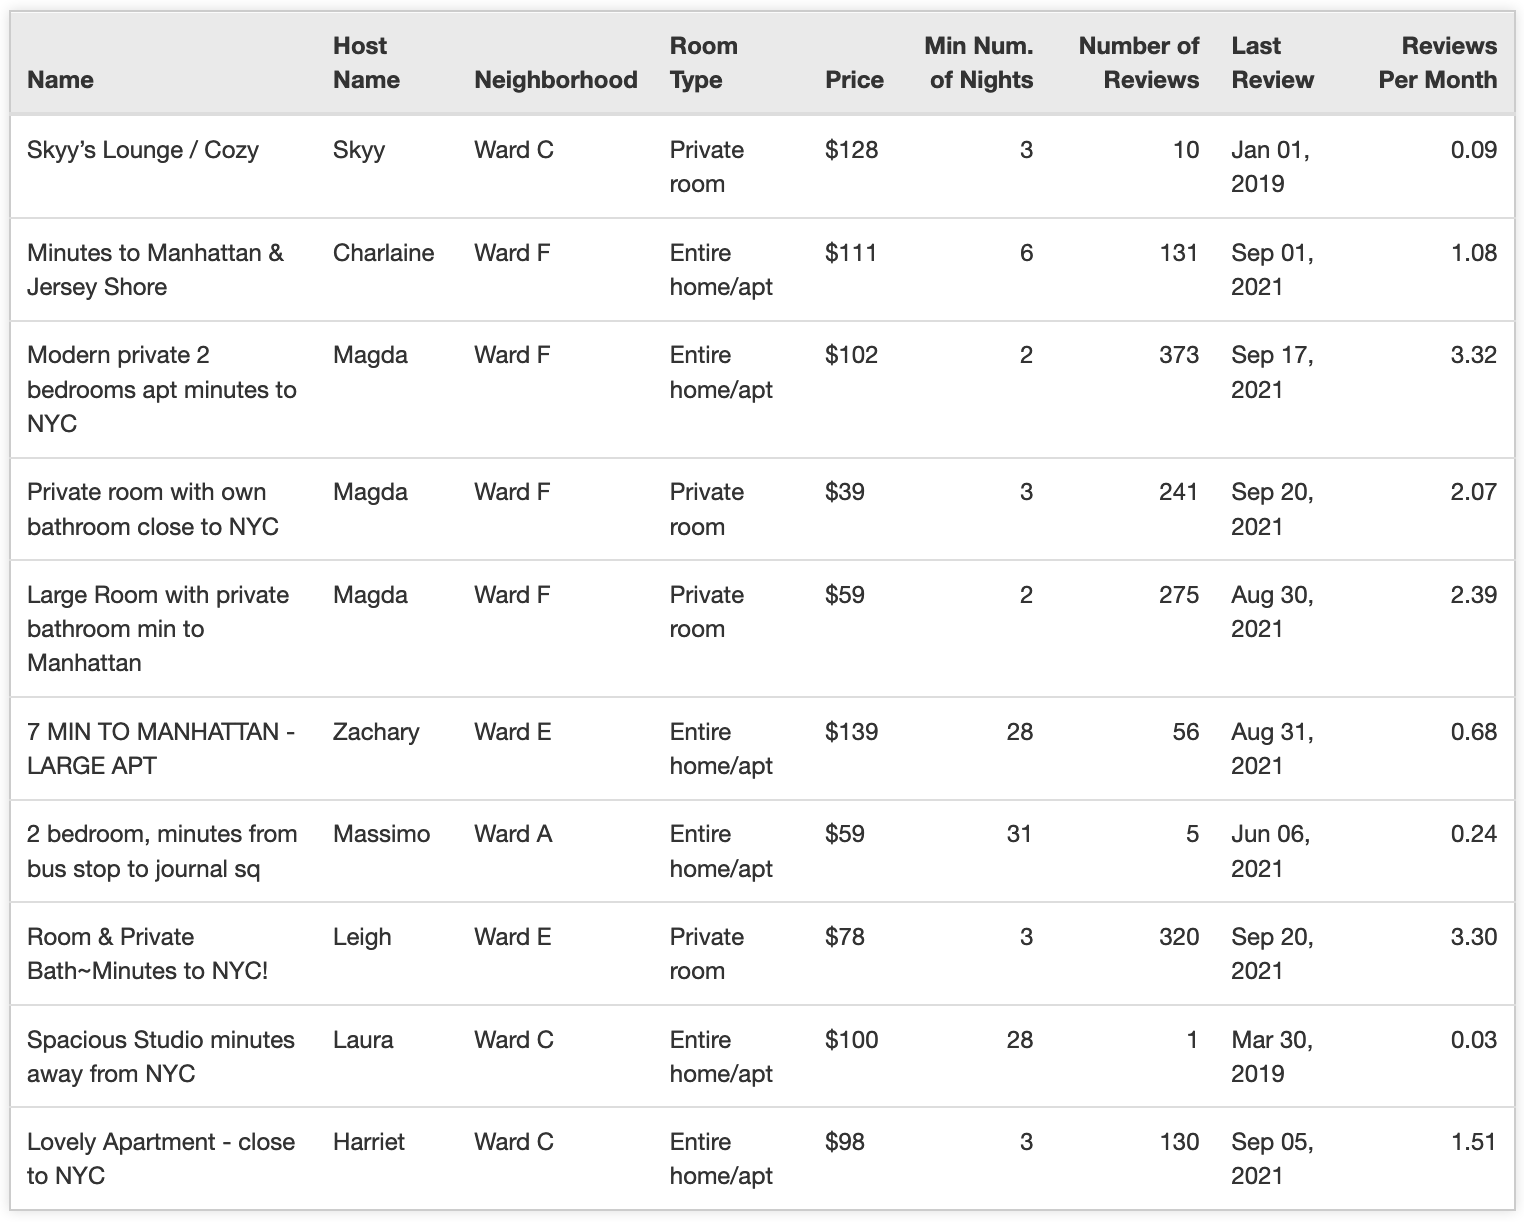
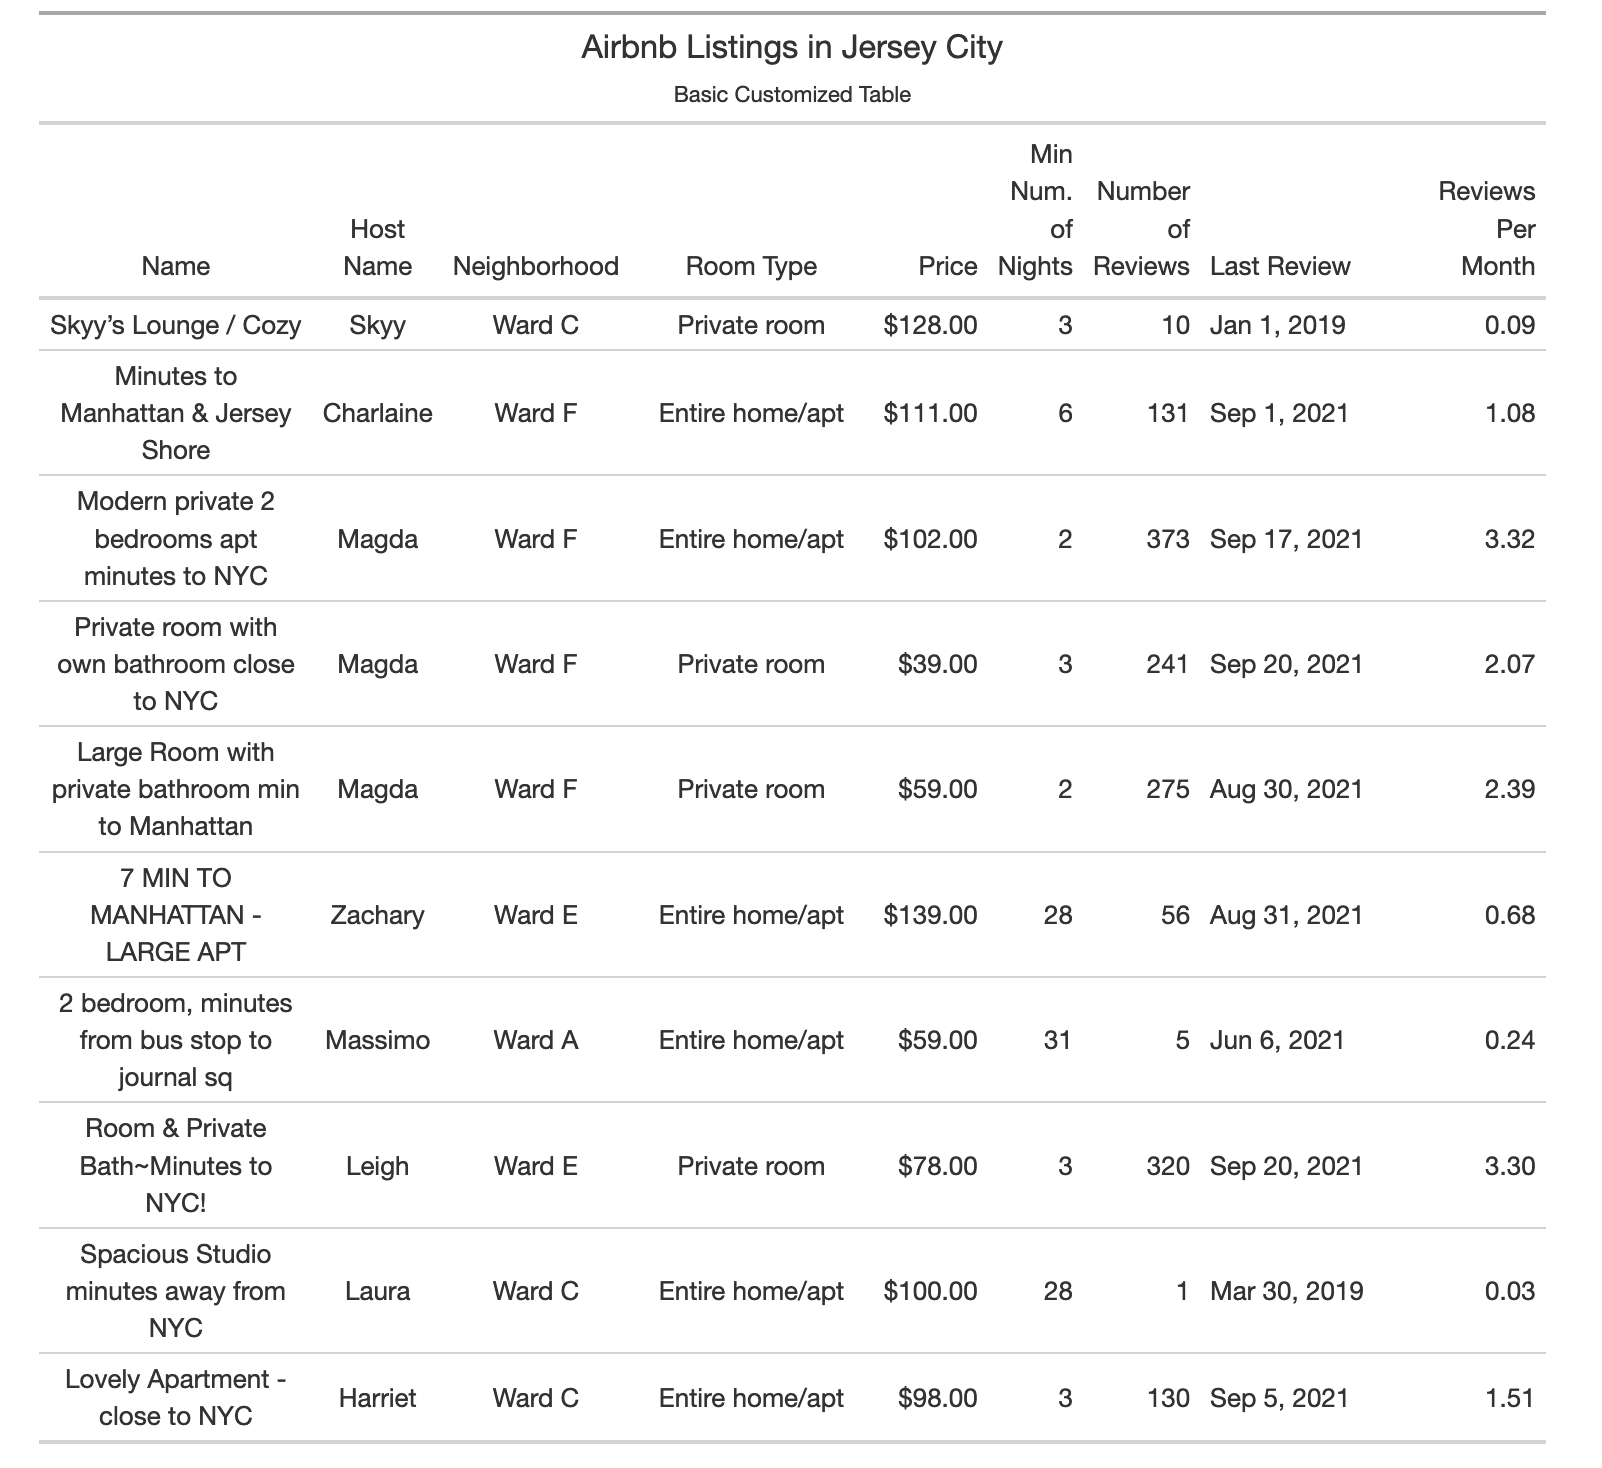
Table Visualizations Created with R - kableExtra & gt
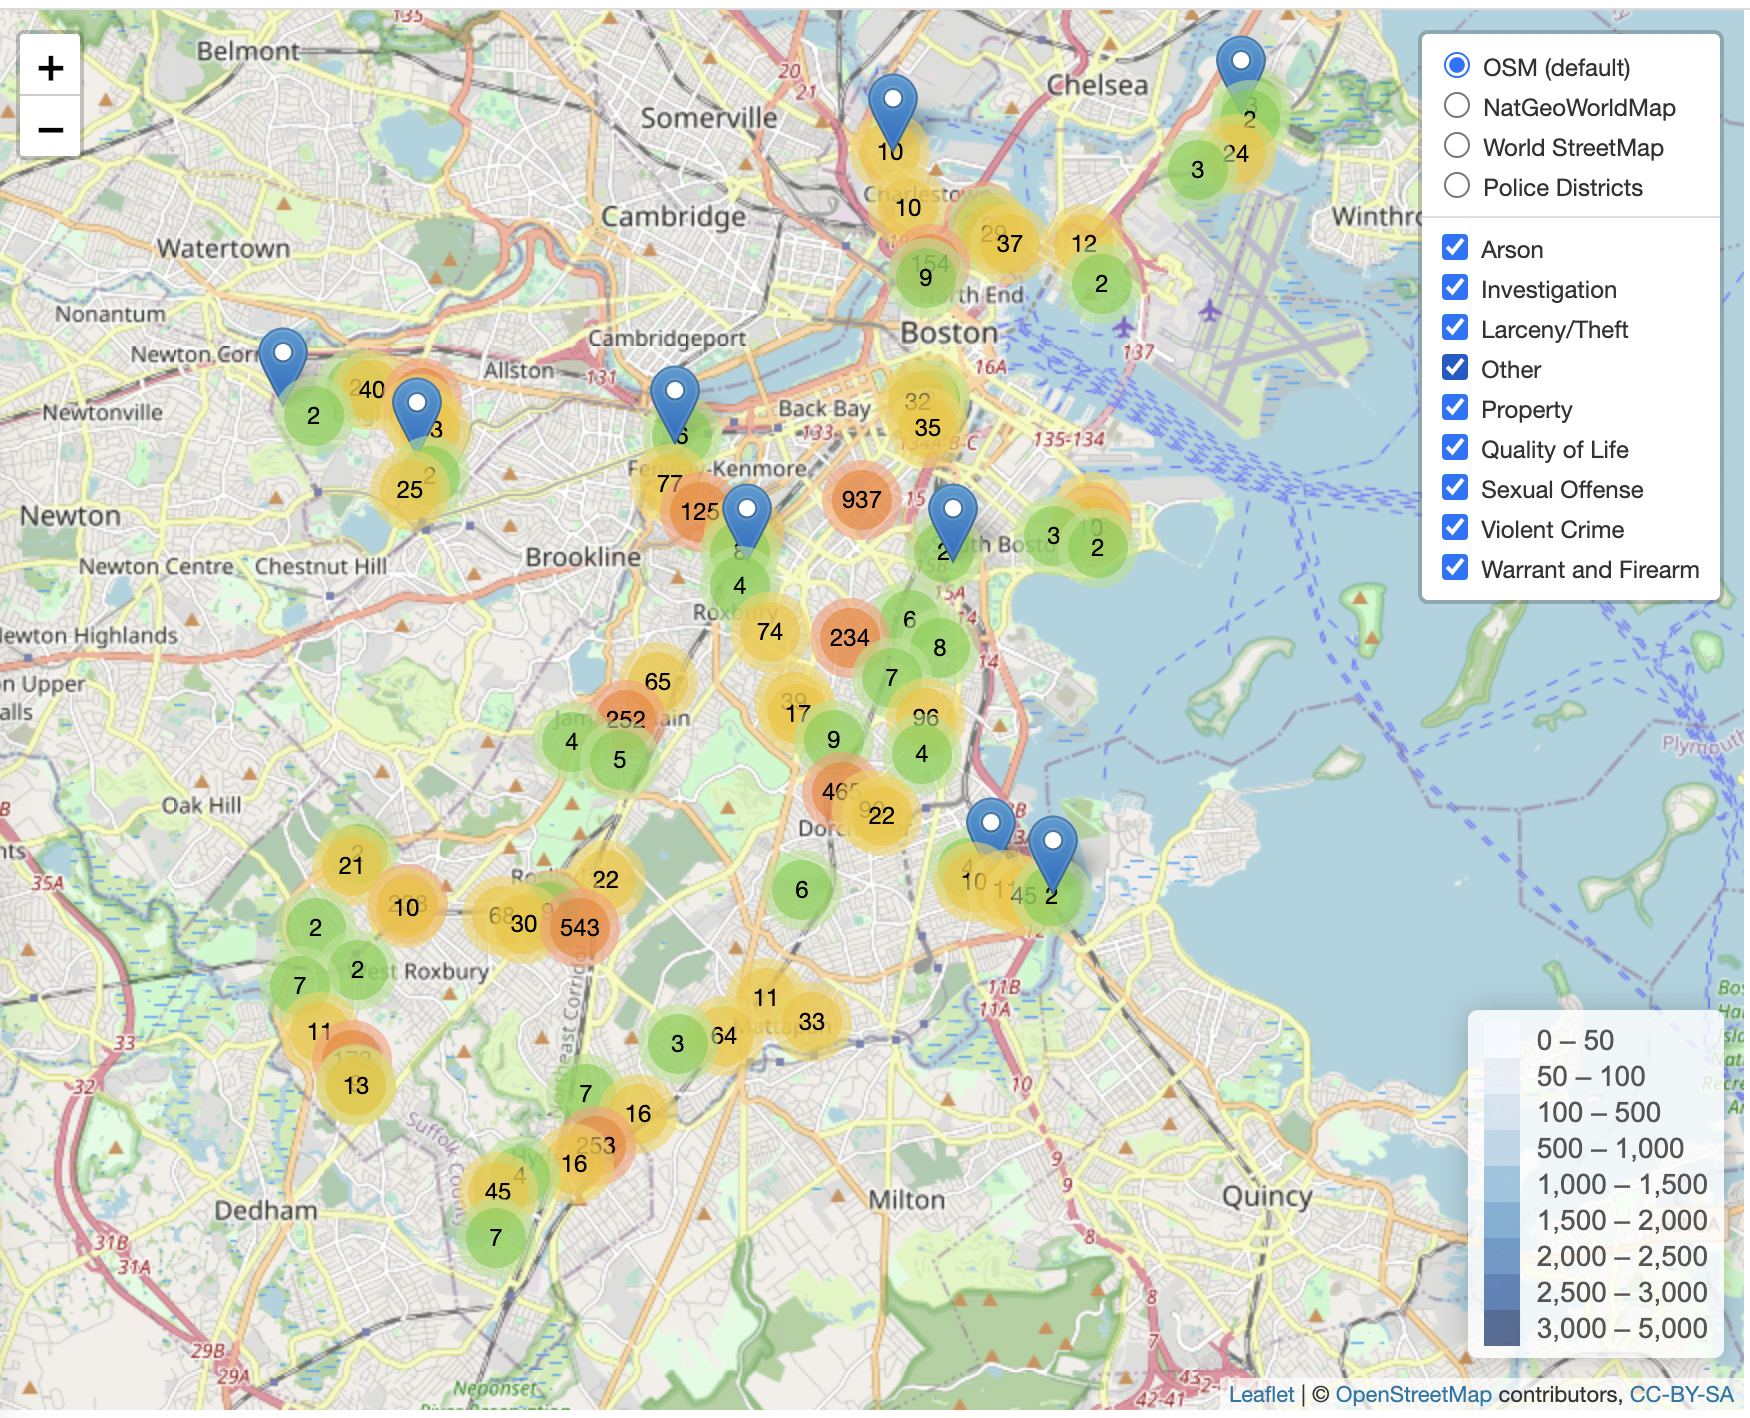
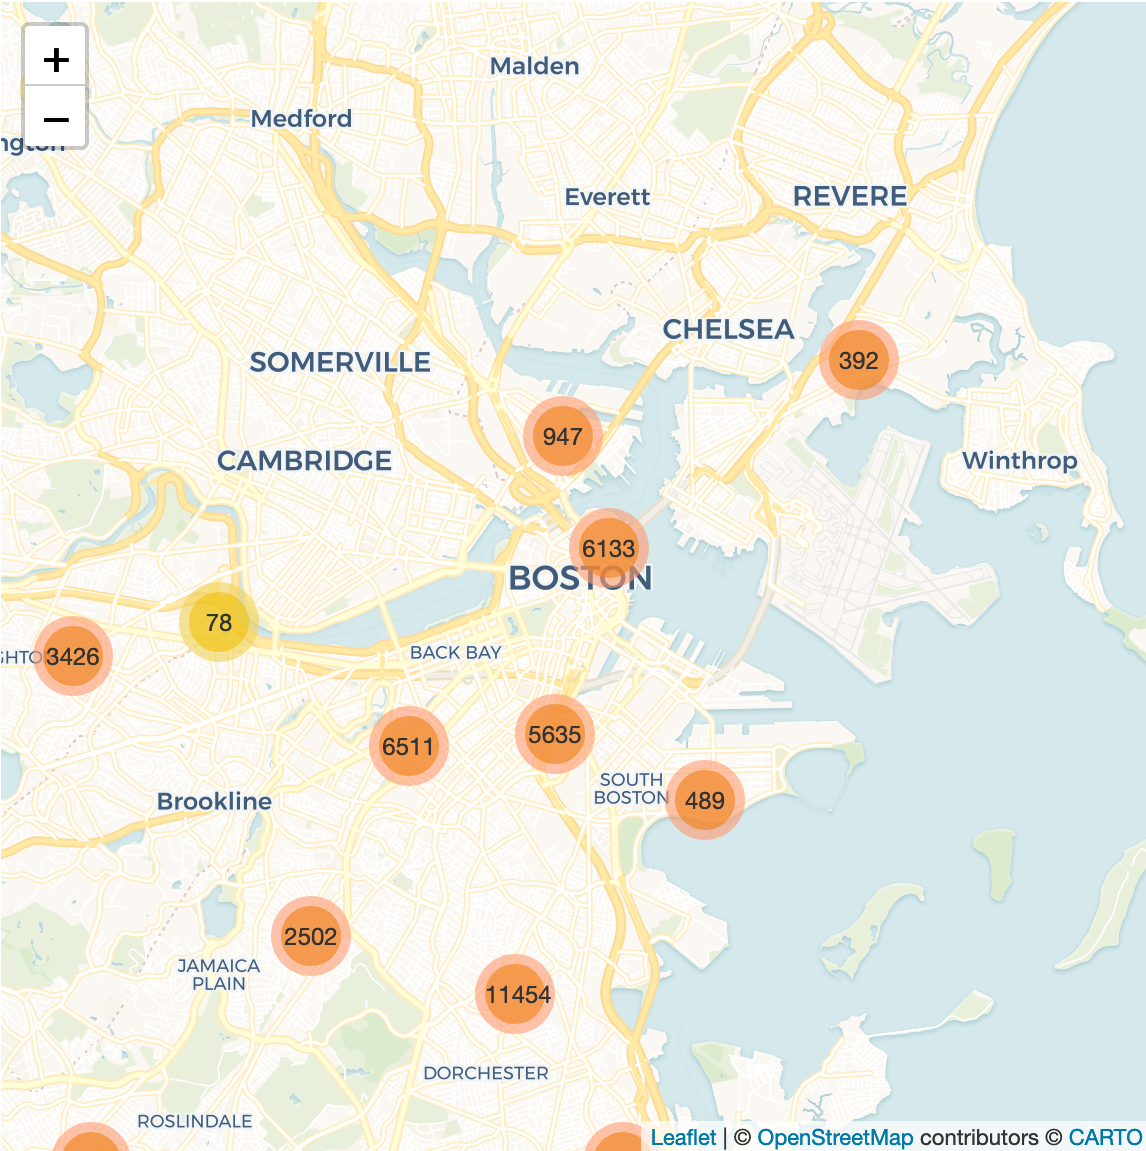
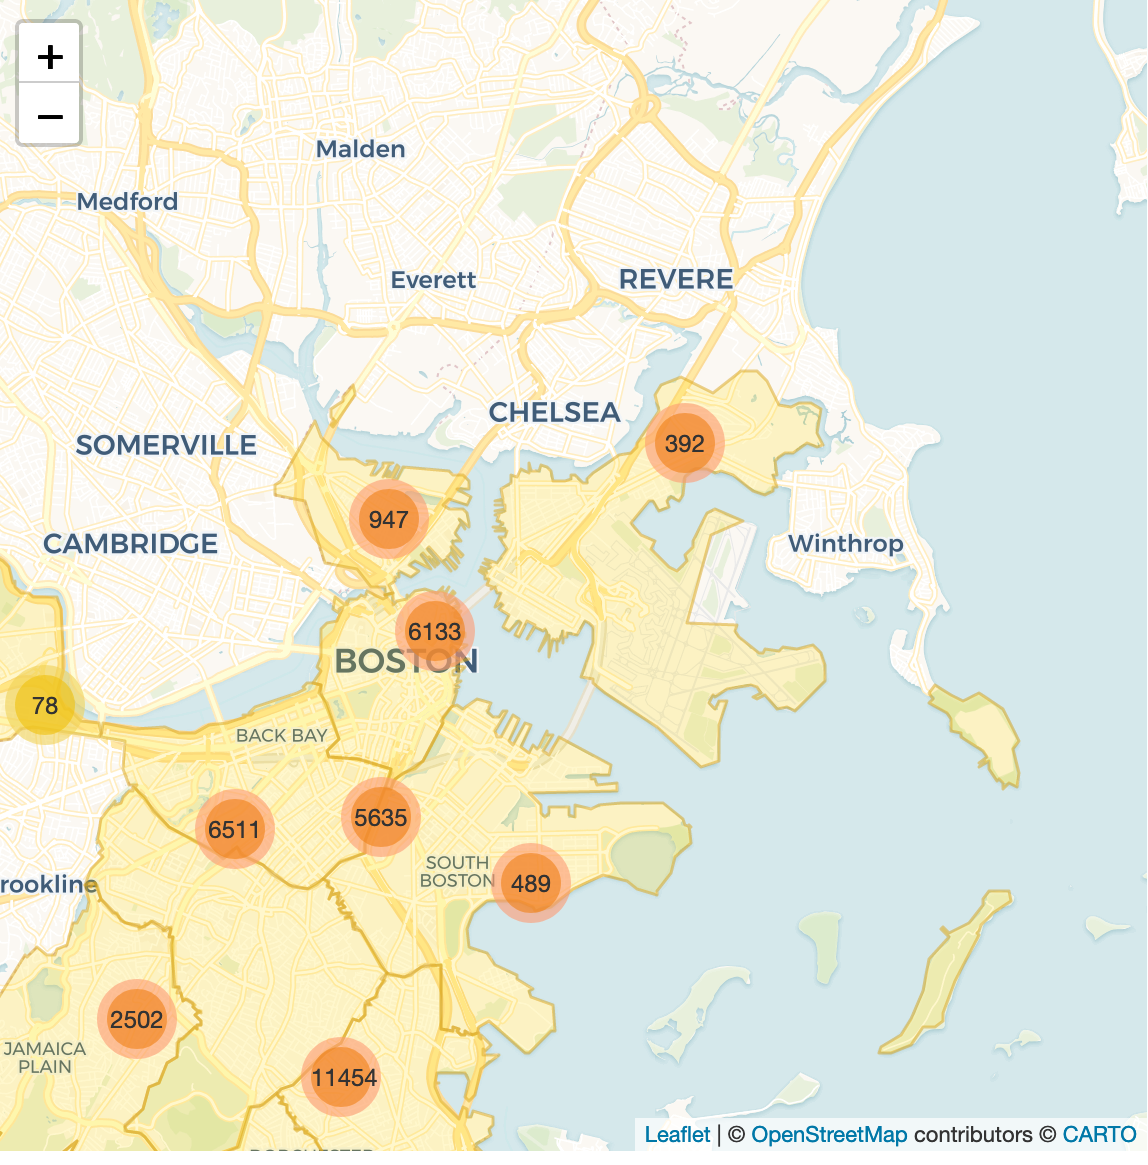
Geospatial Visualizations Created with R - Leaflet
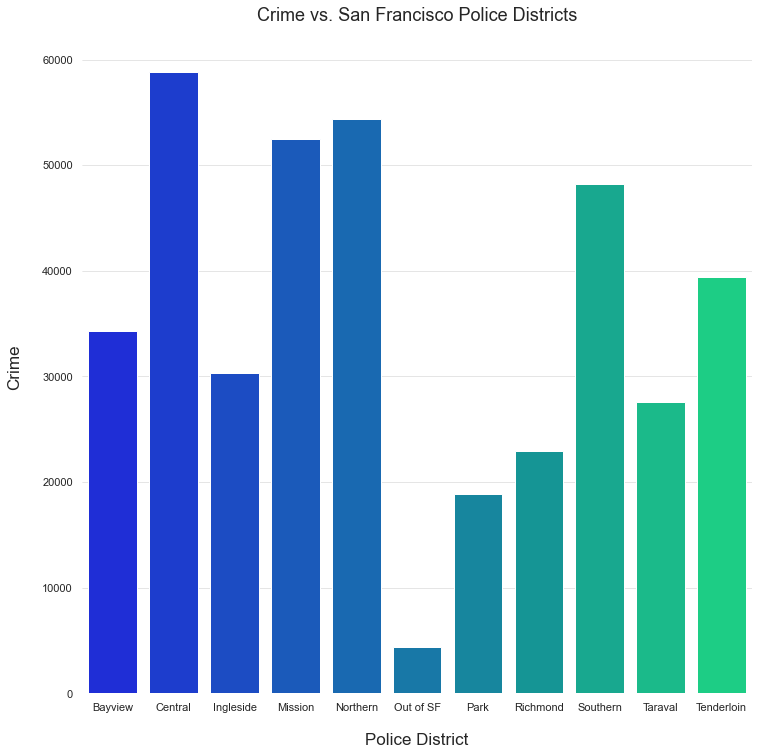
Visualizations Created with Python - Seaborn
.png)
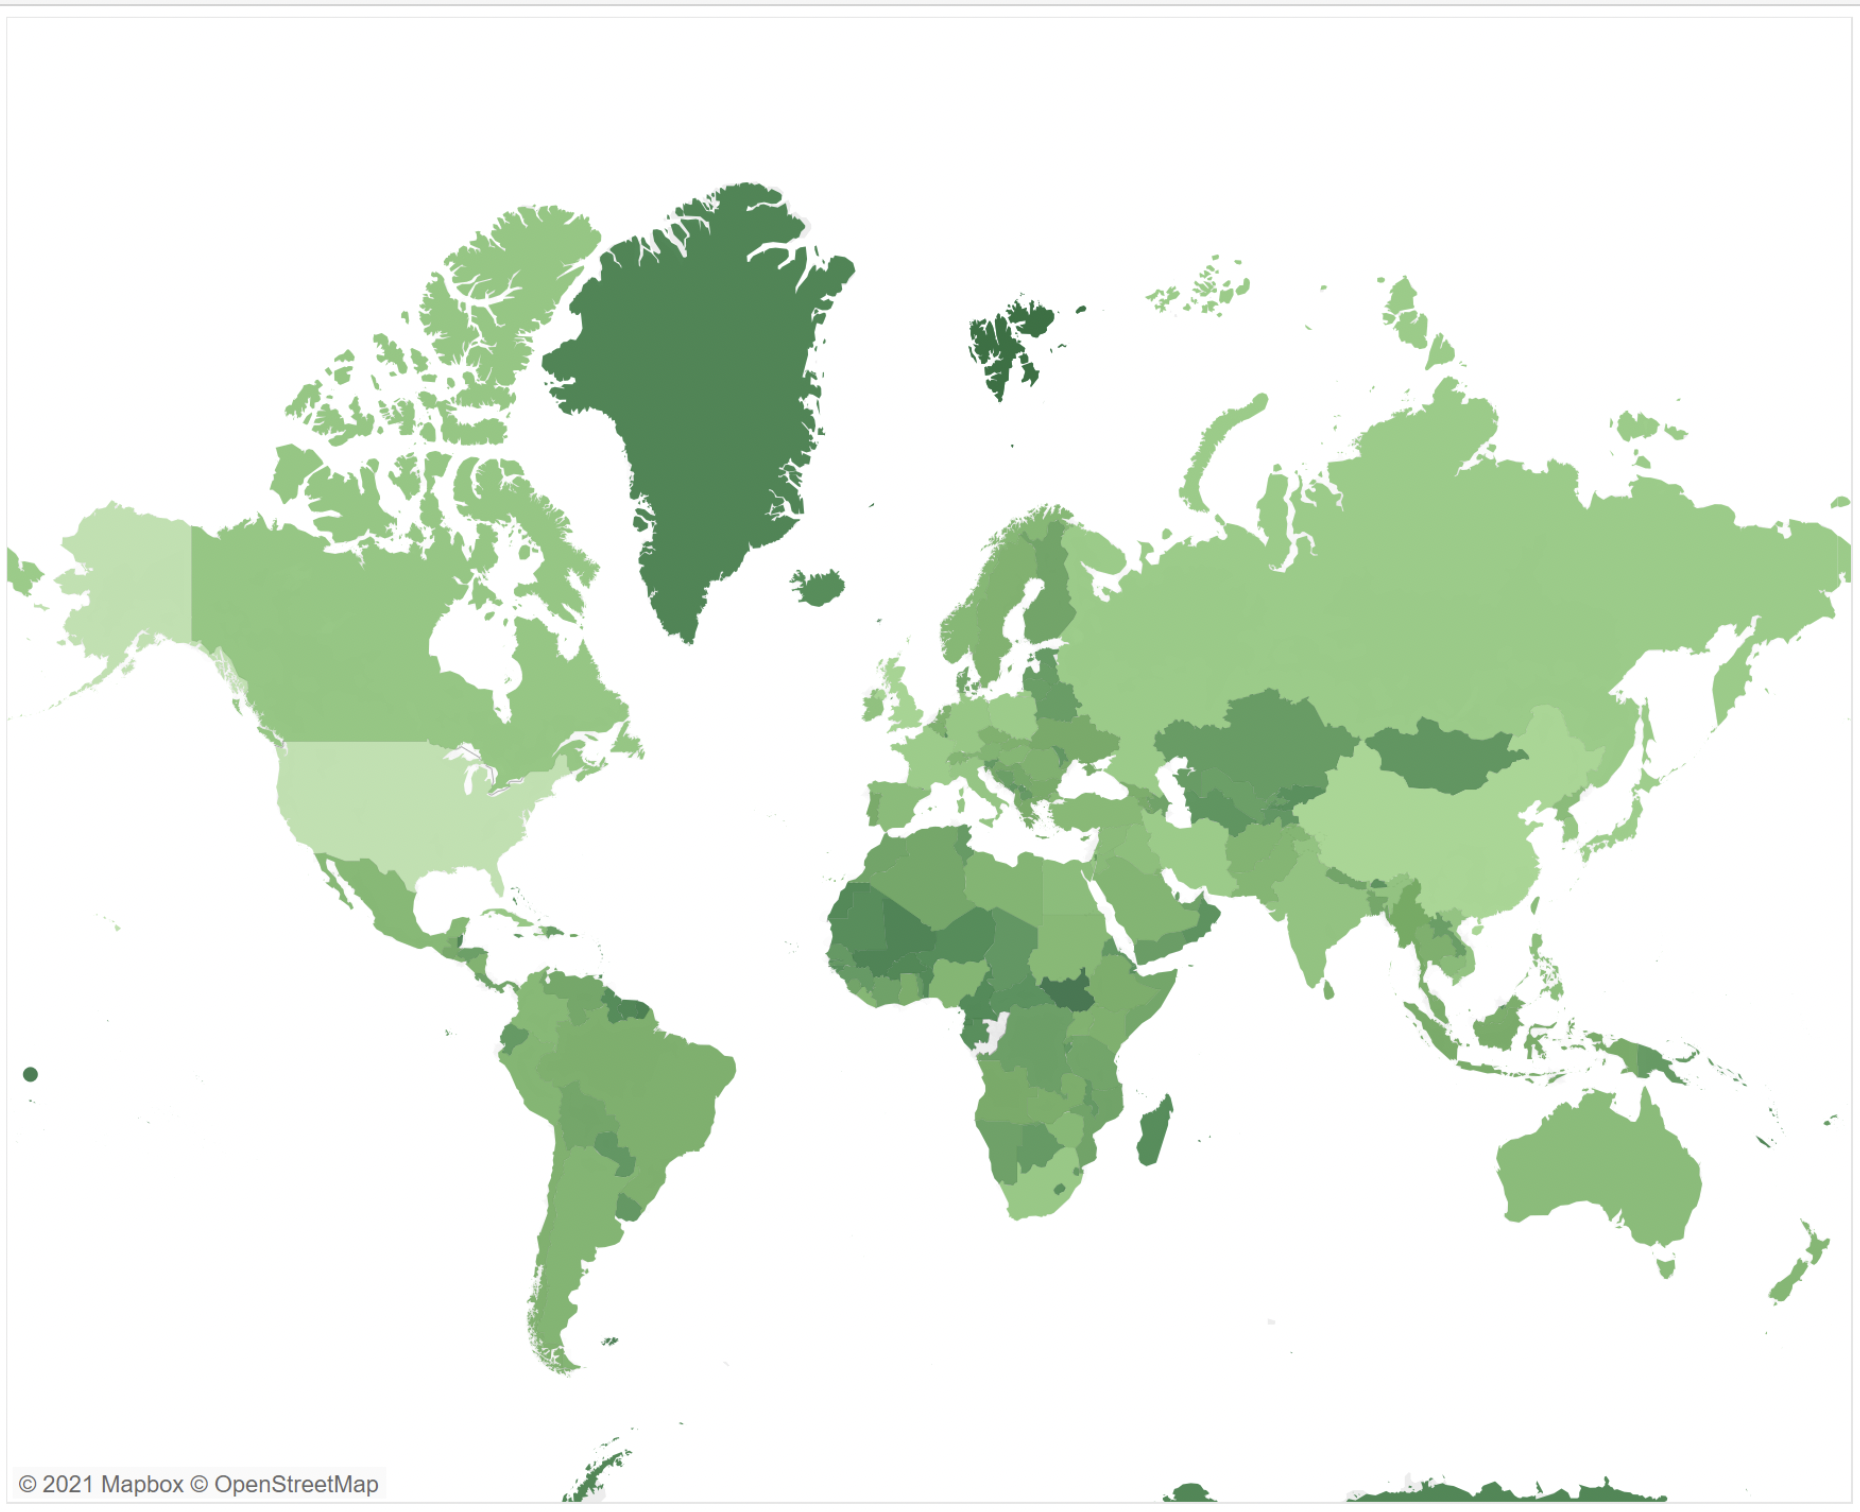
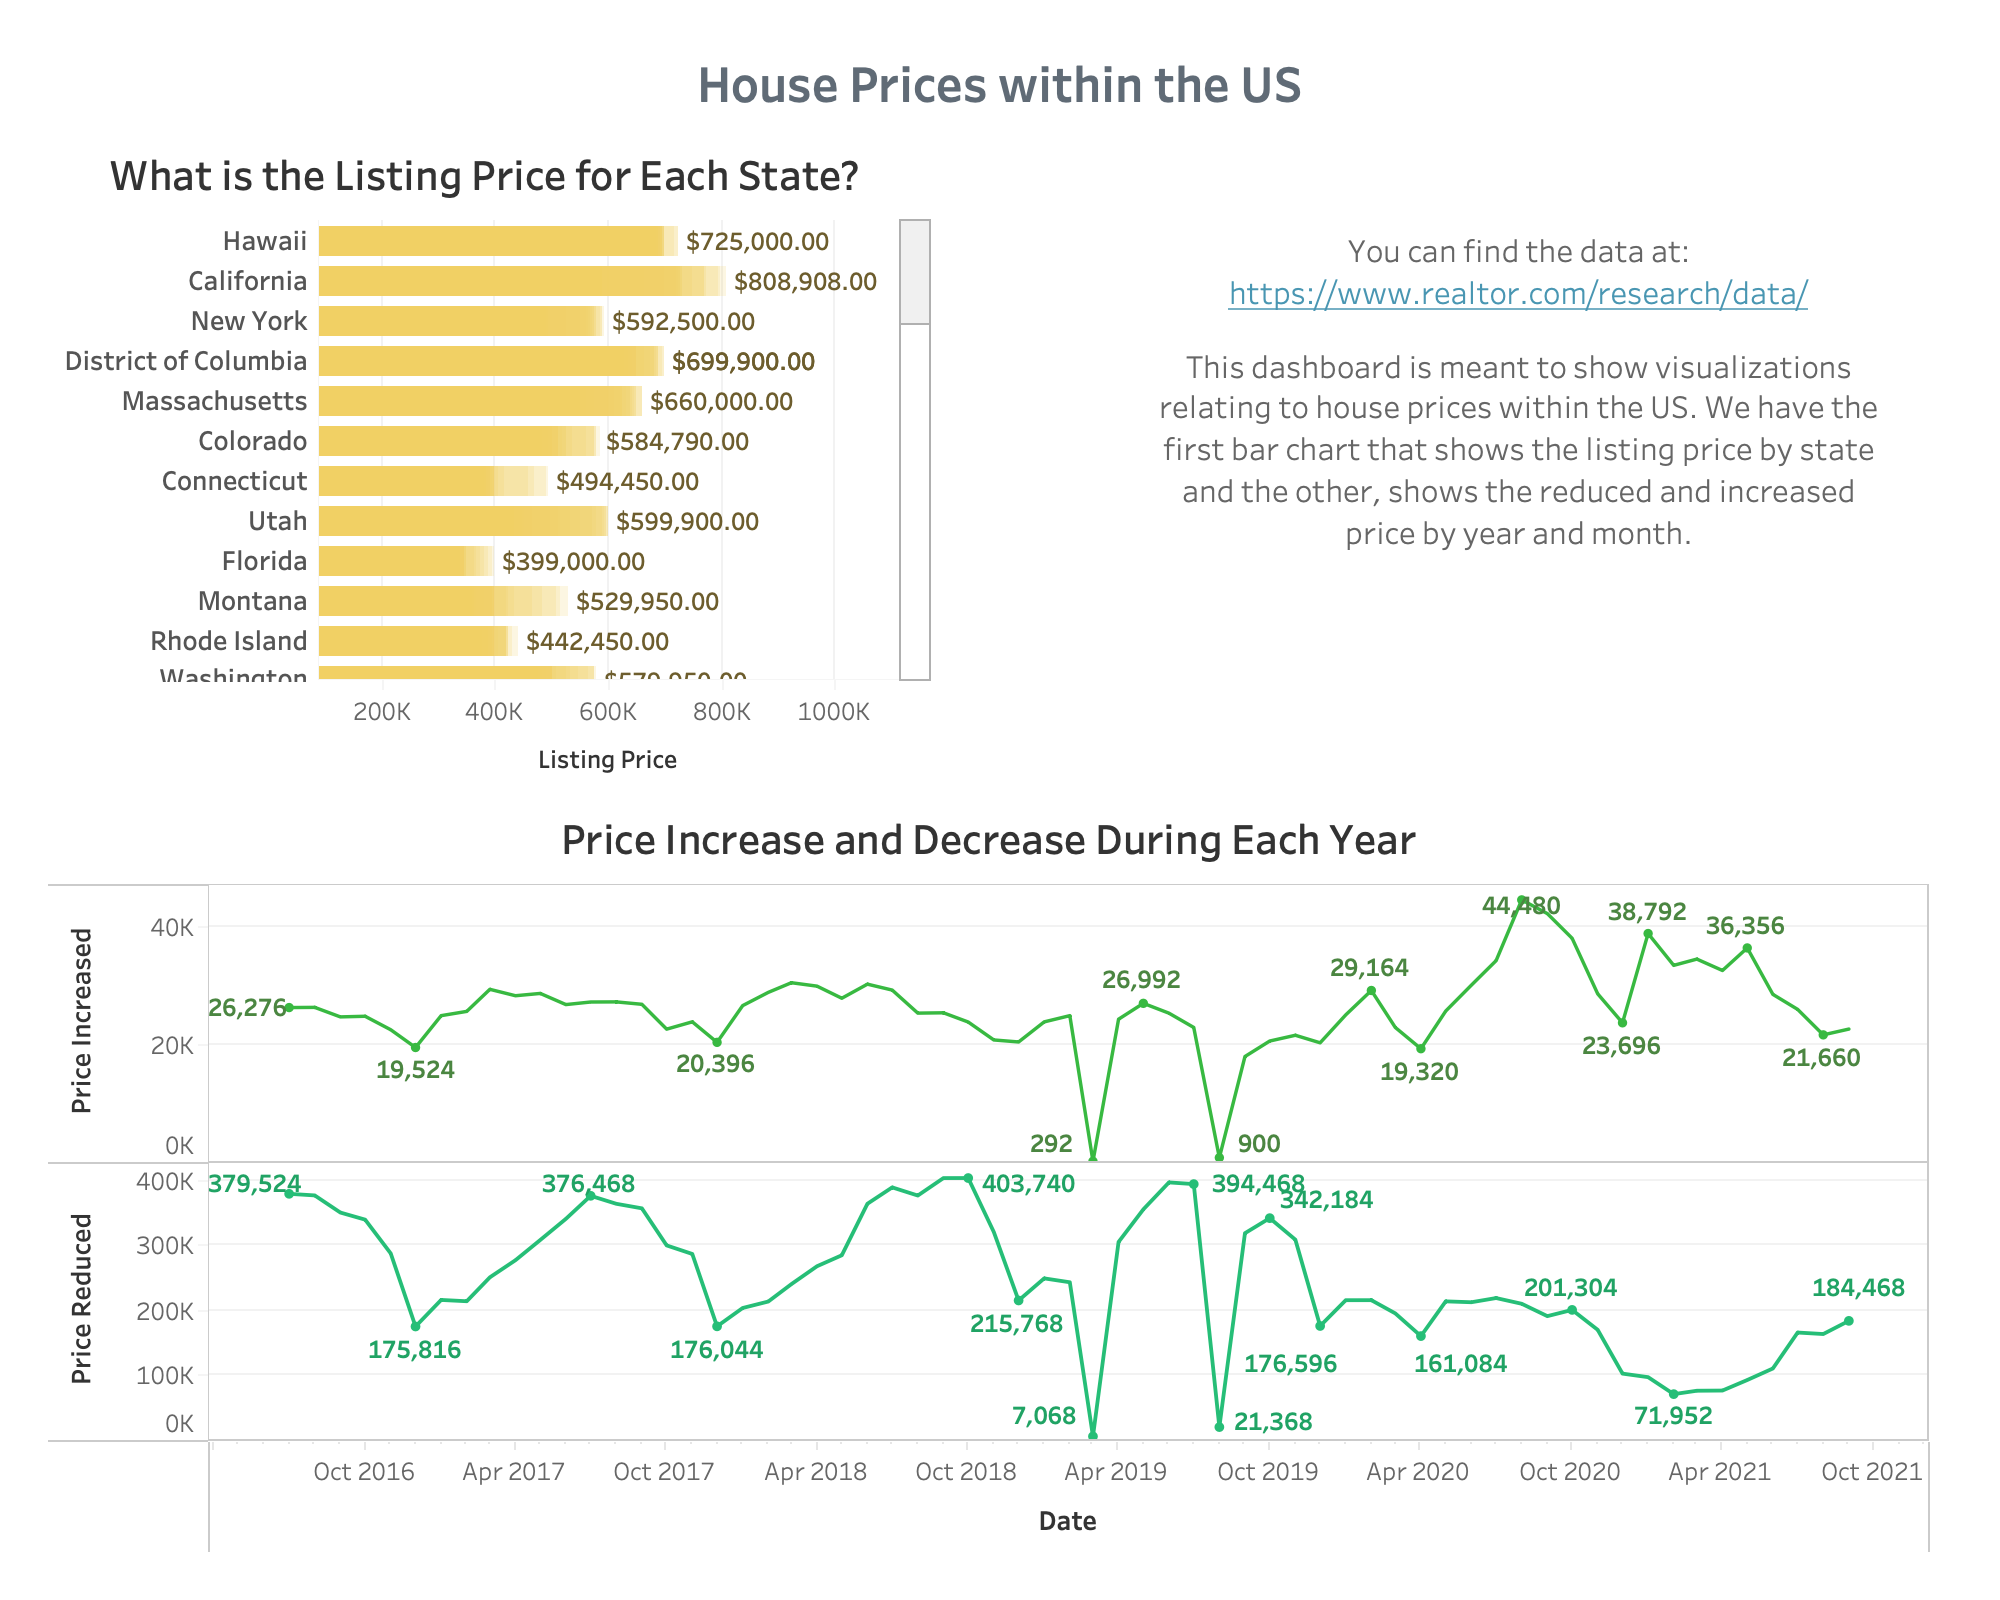
Visualizations Created with Tableau
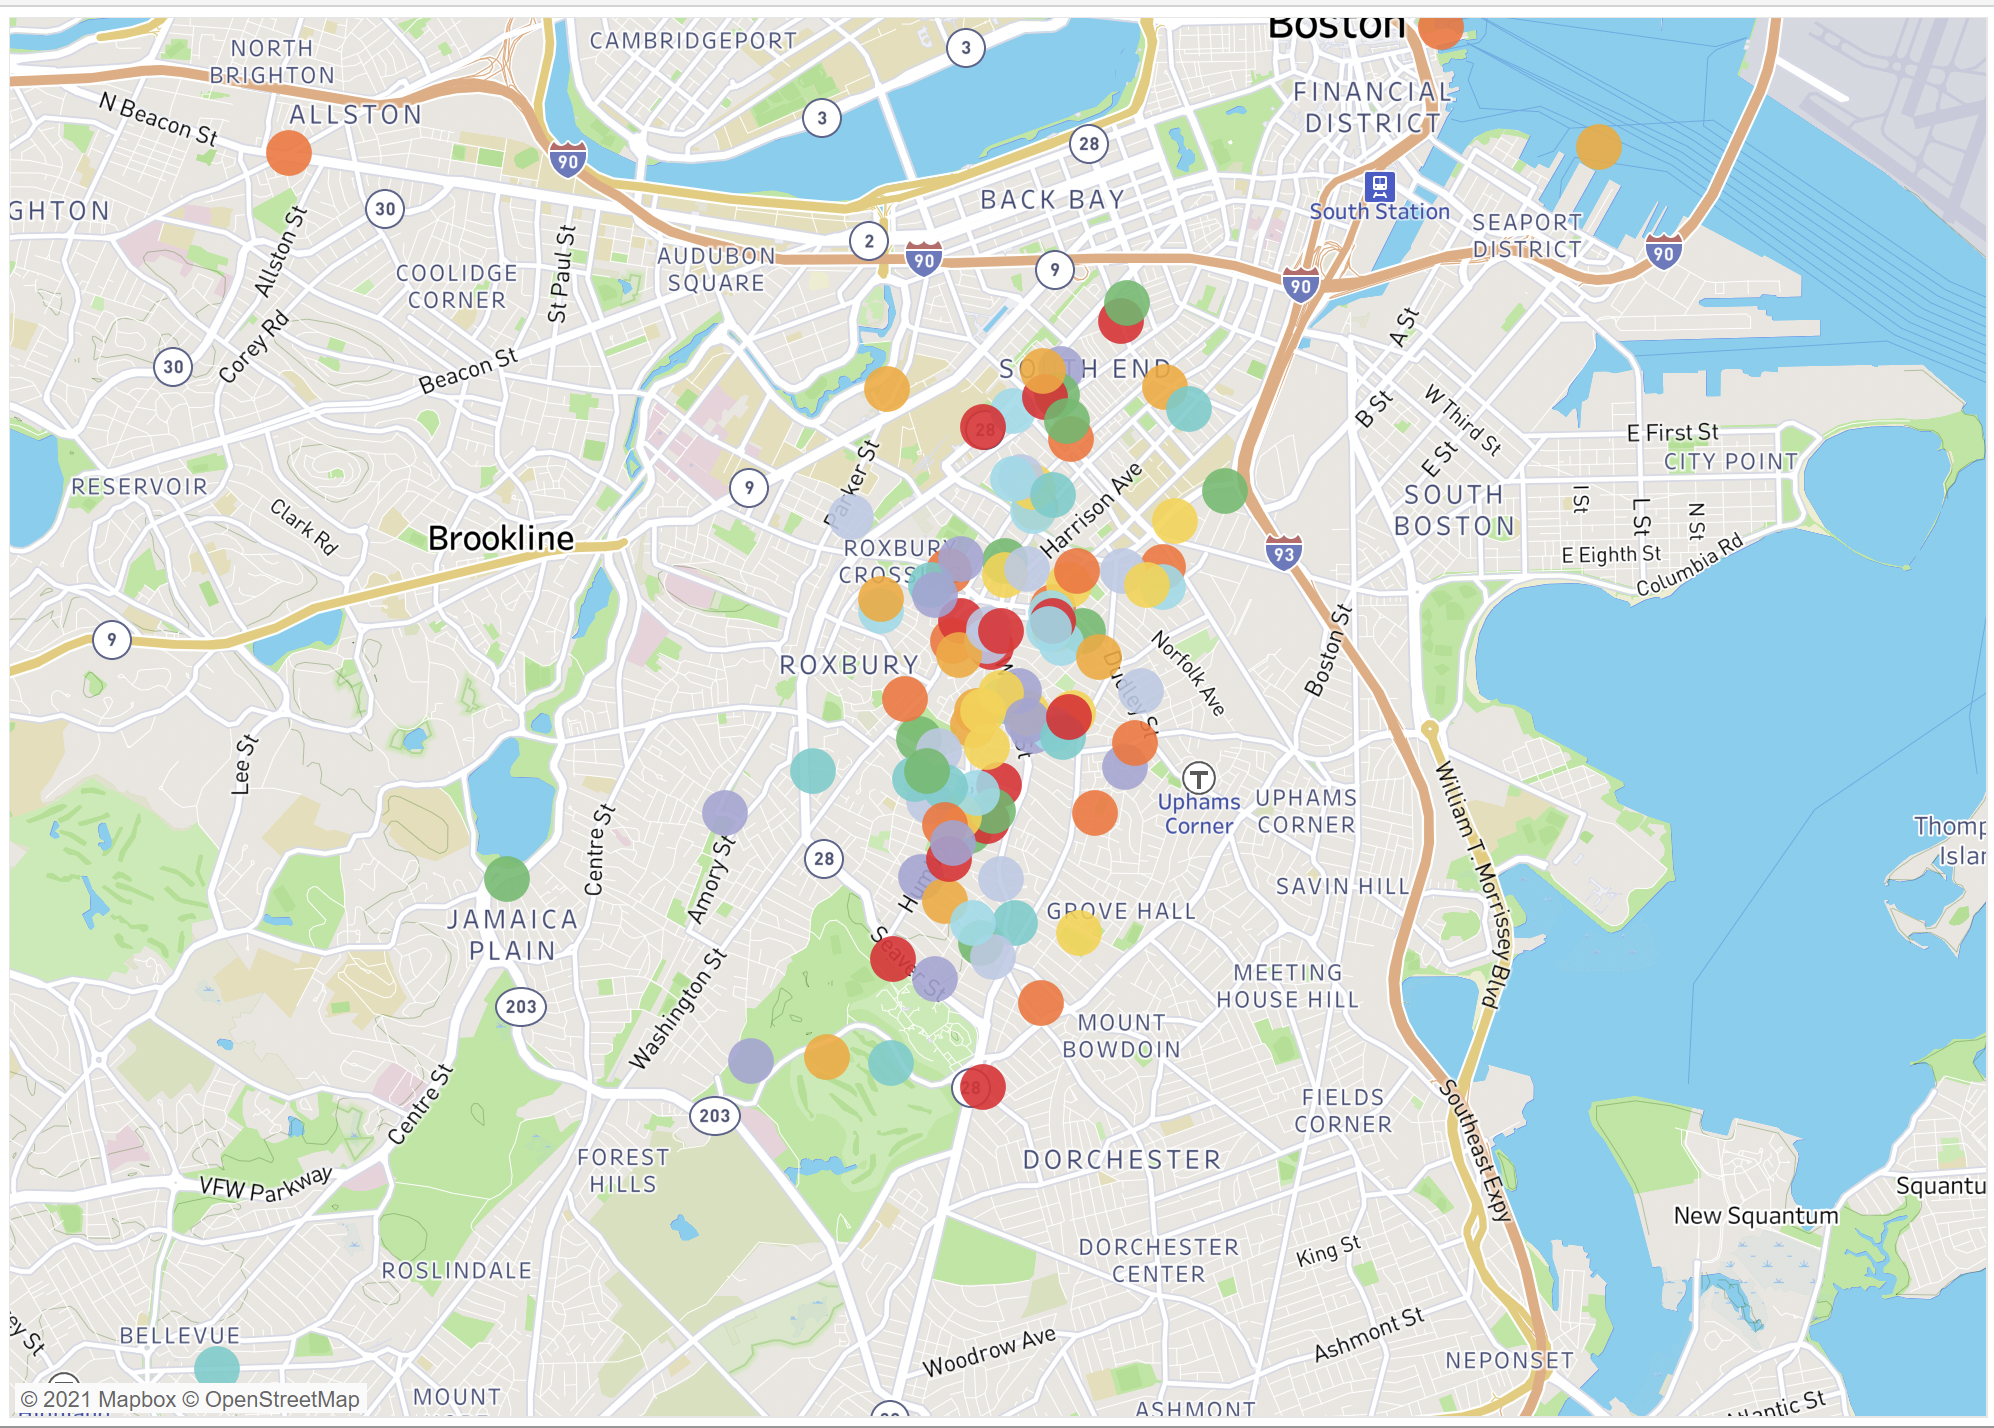
Geospatial Visualizations Created with QGIS & Adobe Illustrator
